Quantcast
Channel: Oslandia

Piero, the open source GIS/BIM 3D Web application!

$
0
0

Piero: a new OpenSource 3D web app for GIS/BIM

Oslandia announces the release of Piero, an opensource application dedicated to digital twins. Piero is a web application based on Giro3D, offering integrated and user-friendly features for visualizing 3D georeferenced data, coming either from the BIM world or from the GIS world.

Ready to use, Piero is available for demonstration at the following address:

https://app.giro3d.org/

Pre-loaded examples are provided, and you can easily start without a single line of code by dragging and dropping your data!

History

Giro3D is a framework for visualizing and handling 2D, 2.5D and 3D GIS data, directly in the browser. This framework can be integrated into any web application, which makes it very versatile. We recently featured LiDAR and WebGL (in French), two of the technologies used by Giro3D.

As a framework, Giro3D is intended for developers and requires some integration efforts. To address broader use cases and showcase Giro3D’s features, Oslandia has developed a complete application on top of Giro3D, with a user-friendly interface and advanced features for data visualization and analysis.

This application, named Piero, is now mature enough to serve as a fully-fledged web application. Leveraging Giro3D and the THREE.js 3D engine to merge the GIS and BIM worlds, Piero is a complete application complète based on Vue.js. Similar to Giro3D, Piero is free, open-source, and its source code is available on GitLab under the MIT license.

Data Formats

In addition to the formats natively supported by Giro3D, Piero covers a wide range of formats, from basic CSV point clouds to very detailed IFC models, including CityJSON, GeoPackage, Shapefile, etc. It also supports OGC web services.

The complete list is available on the project page. New format support is continuously added based on needs. If your preferred format is not supported yet, feel free to let us know. As an open-source and community-driven project, contributions to add data format implementations are also welcome.

Features

Piero goes beyond visualization. From simple identification, as found in QGIS, to annotations and measurements, including cross-sections and clipping boxes, the application provides tools to easily analyze your 3D data. The feature list continus to grow; visit the GitLab page for more detailed information.

Some notable features include:

  • Measurement between planes with automatic plane detection (e.g., from wall to wall in a building),
  • Clipping box for cutting the inside or outside of a box, useful for visualizing 3D elements in buildings,
  • Querying IFC objects with all their attributes,
  • 3D annotations and geo-bookmarks.

Customization

If drag-and-drop data usage is not enough, or if your data is located outside metropolitan France, you can host your own instance of Piero. By editing the configuration through a simple file, you can modify the extent and data sources. Since the application is static (JavaScript and CSS), regenerating and deploying the files on a simple web server is all it takes. In a few command lines, you can have your own customized Piero without modifying a single line of source code.

Piero being open-source and free, you can also modify the application’s source code more deeply if needed. Piero can serve as the basis for dedicated applications with specific features or use cases.

More information

Feel free to contact us by creating a ticket on the GitLab project! Moreover, Piero’s governance is community-driven, and we welcome all contributions! You can also contact Oslandia if you need assistance in training, development, maintenance, data integration, or if you want to establish a partnership on these topics: infos+3d@oslandia.com.


(Fr) [Témoignage Client] Pierrick Yalamas, Auvergne-Rhône-Alpes Énergie Environnement – TerriSTORY®

CityBuilder : make 3D reconstruction easier

$
0
0

Context

Oslandia is participating alongside Eviden in the CP4SC project, run as part of the AMI Cloud launched in 2021 by the Banque Publique d’Investissement.

The acronym CP4SC stands for Cloud Platform for Sustainable Cities, and its aim is to help governments implement ambitious policies towards carbon neutrality by ingesting data from different sources such as mobility, energy management or earth and environmental observation.

LOD - level of detail
Nuage de points

What’s it all about?

3D visualization of buildings is an expectation of many players in urban planning, an expectation that comes up against two stumbling blocks:

  • large-scale, structured 3D data is in short supply
  • there is no mature software solution for working on a large scale, although some publishers offer proprietary tools capable of working on a building scale.

However, the availability and distribution of large-scale point clouds has grown considerably in recent years: field survey methods and tools have evolved considerably, and many players have taken advantage of this to acquire point clouds (including on a national scale, as is the case in France with the Lidar coverage currently being built up by the IGN).

But while point clouds can be acquired rapidly, they are not immediately exploitable for all types of analysis.

Oslandia’s objective with this project is therefore to offer an industrial processing chain for creating structured data from point clouds, as well as software for exploiting this information, all under an open-governance opensource license of course!

We have already presented the Giro3D and Piero tools for visualizing 3D spatial data. Now we’re going to talk about CityJSON generation !

Piero - application web de visualisation de données cartographiques et 3D

CityBuilder

Among the various actions carried out by Oslandia as part of the project, CityBuilder simplifies the reconstruction of georeferenced 3D data. Our initial objective is to offer a QGIS plugin to facilitate user access to the functionalities of the underlying tools.

CityBuilder uses :

  • the geoflow opensource library, developed by the University of Delft and the 3DGI company. Geoflow has been used to generate 3D buildings for the whole of the Netherlands
  • LIDAR ground and surface mapping produced by the French National Geographic Institute (IGN)
  • QGIS 3D visualization functionalities

With regard to the project approach, we initially worked on the first prototypal version of CityBuilder in conjunction with an IT development project (PDI), a sequence of the ENSG‘s Master1 Geomatics and Engineering (2nd year) cycles carried out in partnership with Oslandia.

In 2024, work focused on improving the plugin to make maximum use of native QGIS tools, optimize its performance and reduce its technical debt. We also integrated a command-line version of the code.

processing QGIS pour geoflow

Geoflow has therefore been integrated into a QGIS processing toolbar.

Geoflow generates a JSON output file from a point cloud data file and a building right-of-way data file. We’re using the latest version of geoflow, with LOD Level of Detail up to LOD2.2.

For the ubuntu version, the geoflow docker image used is that of the IGN.

3D data, and now what?

Generated data can be visualized directly in QGIS. This has been made possible by Oslandia’s work on this project over the last two years, which has involved reworking the embedded technical debt, adding tests, correcting anomalies and developing numerous low-level functionalities, so that today we have a much more stable version of QGIS 3D.

As the CP4SC project is cloud-native, it relies on Giro3D and its visualization application, Piero, to display all spatial data, including 3D: reconstructed urban data can therefore also be consulted on the web.

Visualisation de données 3D avec QGIS

Démonstration

Contactez-nous !

Are you interested in this subject? Would you like to pool your development efforts? Would you like to incorporate these functionalities into your IT platforms? Don’t hesitate to contact us to discuss:  infos+3d@oslandia.com

france relance
france 2030

Funded by the European Union – Next Generation EU as part of the France Relance plan

Py3dtiles v7.0.0 just released! New features and a developing community!

$
0
0

(function() { var __SPECTOR_Origin_EXTENSION_GetContext = HTMLCanvasElement.prototype.getContext; HTMLCanvasElement.prototype.__SPECTOR_Origin_EXTENSION_GetContext = __SPECTOR_Origin_EXTENSION_GetContext;

if (typeof OffscreenCanvas !== 'undefined') { var __SPECTOR_Origin_EXTENSION_OffscreenGetContext = OffscreenCanvas.prototype.getContext; OffscreenCanvas.prototype.__SPECTOR_Origin_EXTENSION_OffscreenGetContext = __SPECTOR_Origin_EXTENSION_OffscreenGetContext;

OffscreenCanvas.prototype.getContext = function () { var context = null; if (!arguments.length) { return context; }

if (arguments.length === 1) { context = this.__SPECTOR_Origin_EXTENSION_OffscreenGetContext(arguments[0]); if (context === null) { return context; } } else if (arguments.length === 2) { context = this.__SPECTOR_Origin_EXTENSION_OffscreenGetContext(arguments[0], arguments[1]); if (context === null) { return context; } }

var contextNames = ["webgl", "experimental-webgl", "webgl2", "experimental-webgl2"]; if (contextNames.indexOf(arguments[0]) !== -1) { // context.canvas.setAttribute("__spector_context_type", arguments[0]); // Notify the page a canvas is available. var myEvent = new CustomEvent("SpectorWebGLCanvasAvailableEvent"); document.dispatchEvent(myEvent); this.id = "Offscreen"; window.__SPECTOR_Canvases.push(this);

if (captureOnLoad) { // Ensures canvas is in the dom to capture the one we are currently tracking. if (false) { spector.captureContext(context, 500, false); captureOnLoad = false; } } }

return context; } }

HTMLCanvasElement.prototype.getContext = function () { var context = null; if (!arguments.length) { return context; }

if (arguments.length === 1) { context = this.__SPECTOR_Origin_EXTENSION_GetContext(arguments[0]); if (context === null) { return context; } } else if (arguments.length === 2) { context = this.__SPECTOR_Origin_EXTENSION_GetContext(arguments[0], arguments[1]); if (context === null) { return context; } }

var contextNames = ["webgl", "experimental-webgl", "webgl2", "experimental-webgl2"]; if (contextNames.indexOf(arguments[0]) !== -1) { context.canvas.setAttribute("__spector_context_type", arguments[0]); // Notify the page a canvas is available. var myEvent = new CustomEvent("SpectorWebGLCanvasAvailableEvent"); document.dispatchEvent(myEvent);

if (captureOffScreen) { var found = false; for (var i = 0; i

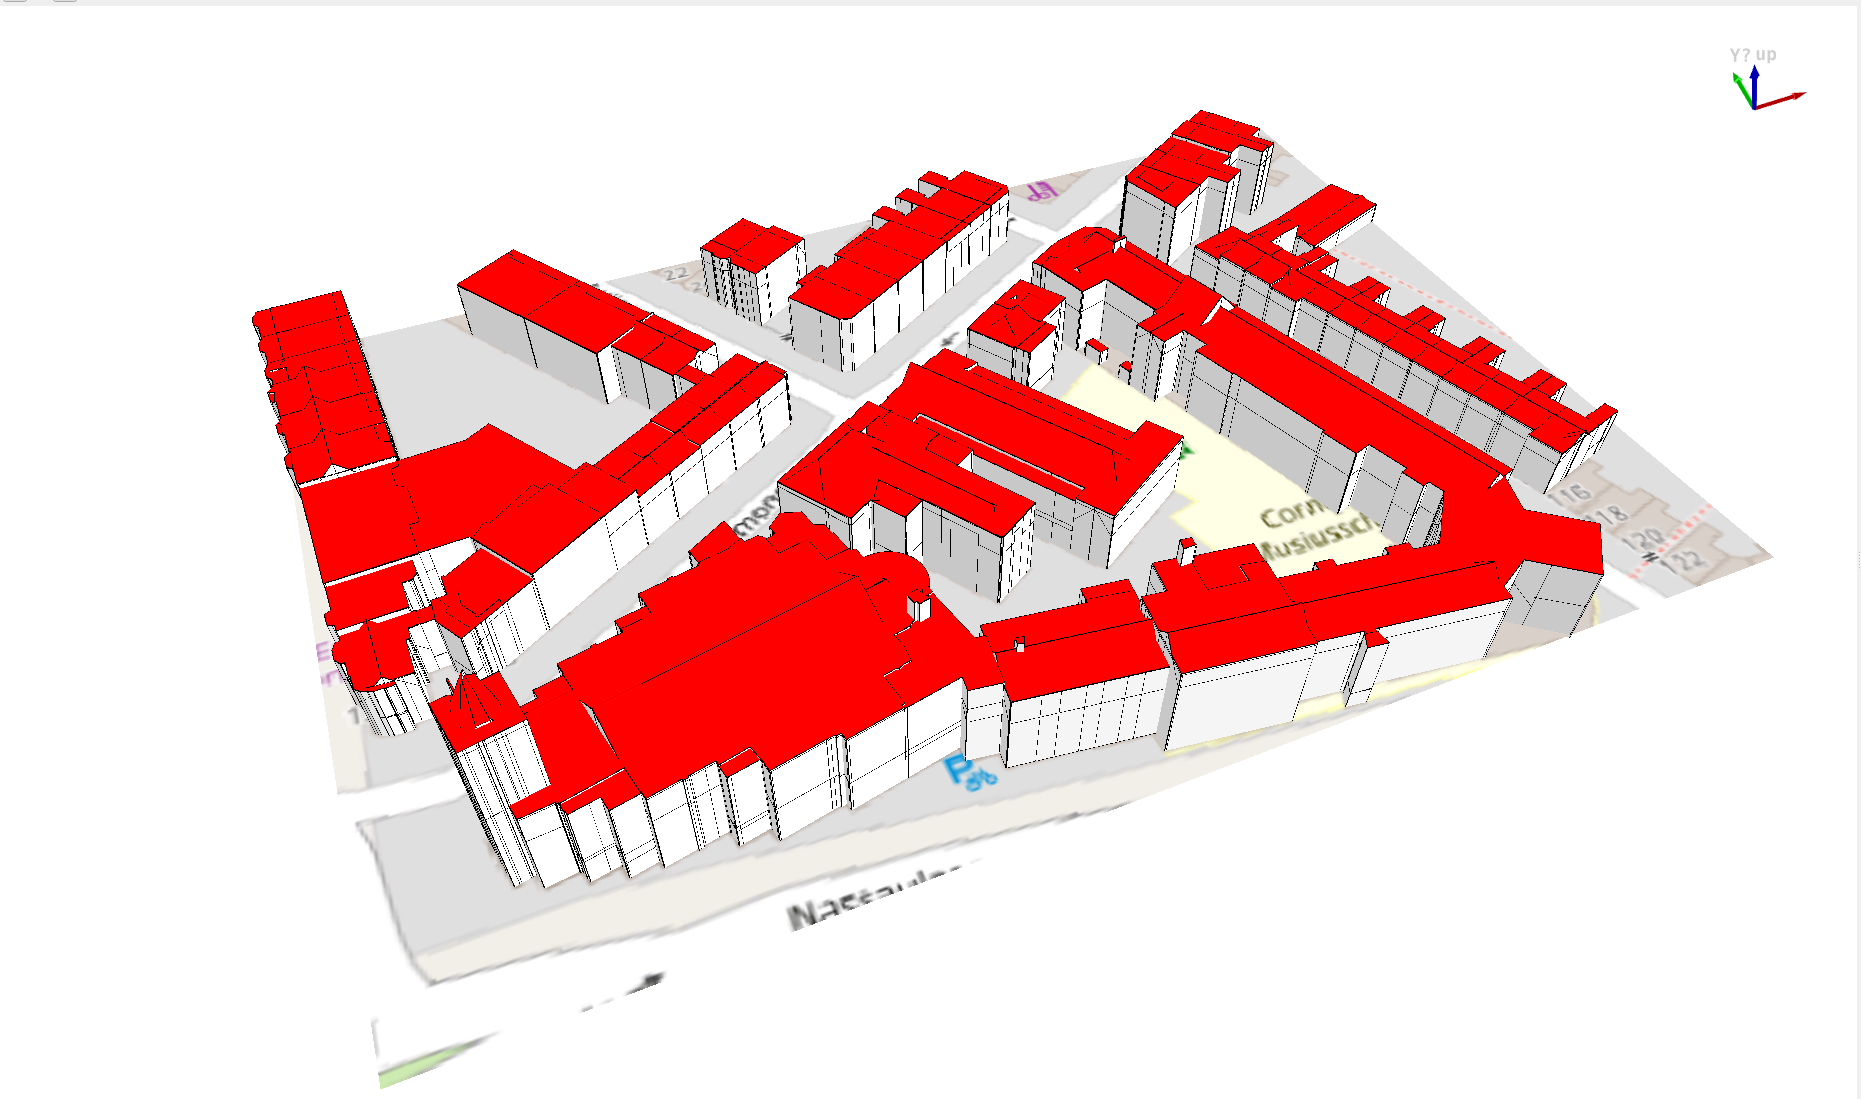
Py3dtiles is a command-line Python library and tool for generating, reading and modifying 3D Tiles dataset. You can use it alone or integrate it into your own Python application.

Version 7.0.0 has just been released, it's time to take a little retrospective on the last few years!

The community and a new maintainer

We welcome a new maintainer: Lorenzo Marnat (Liris). Liris has contributed very significantly to py3dtiles and has carried out significant R&D work on their fork and via the py3dtilers application. For several months, Lorenzo has been carrying out the work of integration into the common core, a real painstaking task that is so necessary. Integrating him into the team was therefore the logical step in this process.

This means that py3dtiles is no longer an Oslandian-only project! This is a very important step in the development of a truly community project and we are very happy to have him on the team.

As a result, some changes have been adopted to make py3dtiles more independent of Oslandia. We hope to encourage external contributions and the involvement of entities other than Oslandia and Liris:

  • The code repository has been moved to its own organization: https://gitlab.com/py3dtiles/py3dtiles. We took the opportunity to rename the master branch to main (so that we don't deviate from gitlab new default branch name).
  • The website is now hosted at https://py3dtiles.org. A redirection of the old site has been implemented, but we still recommend updating your web bookmarks.
  • We now have a document describing governance: GOVERNANCE.md, which describes how the community works.
  • And we now have a chat channel on matrix.org!

IGN Lidar HD dataset, converted with py3dtiles and viewed with giro3d

(function() { var __SPECTOR_Origin_EXTENSION_GetContext = HTMLCanvasElement.prototype.getContext; HTMLCanvasElement.prototype.__SPECTOR_Origin_EXTENSION_GetContext = __SPECTOR_Origin_EXTENSION_GetContext;

if (typeof OffscreenCanvas !== 'undefined') { var __SPECTOR_Origin_EXTENSION_OffscreenGetContext = OffscreenCanvas.prototype.getContext; OffscreenCanvas.prototype.__SPECTOR_Origin_EXTENSION_OffscreenGetContext = __SPECTOR_Origin_EXTENSION_OffscreenGetContext;

OffscreenCanvas.prototype.getContext = function () { var context = null; if (!arguments.length) { return context; }

if (arguments.length === 1) { context = this.__SPECTOR_Origin_EXTENSION_OffscreenGetContext(arguments[0]); if (context === null) { return context; } } else if (arguments.length === 2) { context = this.__SPECTOR_Origin_EXTENSION_OffscreenGetContext(arguments[0], arguments[1]); if (context === null) { return context; } }

var contextNames = ["webgl", "experimental-webgl", "webgl2", "experimental-webgl2"]; if (contextNames.indexOf(arguments[0]) !== -1) { // context.canvas.setAttribute("__spector_context_type", arguments[0]); // Notify the page a canvas is available. var myEvent = new CustomEvent("SpectorWebGLCanvasAvailableEvent"); document.dispatchEvent(myEvent); this.id = "Offscreen"; window.__SPECTOR_Canvases.push(this);

if (captureOnLoad) { // Ensures canvas is in the dom to capture the one we are currently tracking. if (false) { spector.captureContext(context, 500, false); captureOnLoad = false; } } }

return context; } }

HTMLCanvasElement.prototype.getContext = function () { var context = null; if (!arguments.length) { return context; }

if (arguments.length === 1) { context = this.__SPECTOR_Origin_EXTENSION_GetContext(arguments[0]); if (context === null) { return context; } } else if (arguments.length === 2) { context = this.__SPECTOR_Origin_EXTENSION_GetContext(arguments[0], arguments[1]); if (context === null) { return context; } }

var contextNames = ["webgl", "experimental-webgl", "webgl2", "experimental-webgl2"]; if (contextNames.indexOf(arguments[0]) !== -1) { context.canvas.setAttribute("__spector_context_type", arguments[0]); // Notify the page a canvas is available. var myEvent = new CustomEvent("SpectorWebGLCanvasAvailableEvent"); document.dispatchEvent(myEvent);

if (captureOffScreen) { var found = false; for (var i = 0; i

Functional developments

3Dtiles support improvements

In version 2, py3dtiles still suffered from the absence of these few classes describing 3Dtiles concepts, and which are now present in version 7:

  • BoundingVolumeBox
  • TileSet
  • Tile
  • Extension

Feature tables are now supported for b3dm in addition to pnts.

New formats

Py3dtiles now supports PLY (point cloud only) and LAZ files.

XYZ and CSV support has been improved, with auto-detection of the CSV format.

py3dtiles merge

This is a new command allowing you to generate a tileset from 2 other tilesets. For the moment the generation of root tiles is quite naive, but should work very well with point clouds.

Other features

It is now possible to export point cloud classifications into pnts.

Support for batch tables has been added.

Technical improvements

Packaging

Optional dependencies

With support for additional formats, the number of py3dtiles dependencies increases significantly. We've created optional dependency sections, to avoid asking users to install libraries for formats they don't use.

Docker image

We are now publishing docker images to the gitlab registry and docker hub.

Windows support

Initial work to support Windows has been done, but work remains to be done to produce an .exe to facilitate deployment.

Code quality

A lot of effort has been made to make contributing more enjoyable and overall improve the quality of the code. Automatic code analyzers have been implemented, including linters and a SonarCloud.

We have made a specific effort to type our function and variable declarations with the new possibilities offered by modern versions of Python.

Future

The main point will be support for geometries in the multi-process conversion process launched by py3dtiles convert. This will then provide support for geometric formats, in particular IFC! (But also, improved PLY support, PostGIS tables, OBJs, etc.).

Other improvements are of course in the works.

Get involved!

Py3dtiles is community software and will do better if you participate! Testing, opening tickets, even contributing or financing are actions that are very useful for the project. The community contribution guide is here. Alternatively, do not hesitate to contact us to discuss!

(Fr) [Equipe Oslandia] Jean, ingénieur SIG

(Fr) En direct des Journées Utilisateurs QGIS-fr !

(Fr) [1’Tech by Oslandia] Réversibilité

(Fr) Étude EDF Indoor – déplacements & guidage en intérieur et réalisation d’un prototype


Giro3D 0.35: what’s new?

$
0
0

Giro3D is a Javascript library for visualizing geospatial data on the Web. Used in particular by the Piero application, it is compatible with a wide range of raster and vector data sources, as well as 3D data such as point clouds.

Version 0.35 brings a number of new features, including significant performance enhancements useful for complex scenes with numerous data sources.

Performance improvements

These improvements mainly concern the display of raster data (color or elevation) on the Map entity:

  • Reduced memory usage of Map tiles
  • Reduced image display latency on the Map
  • Reduction in the number of HTTP requests made
  • Increased tile processing speed

New features

THREE.js fog support

👉 See the interactive example

Map entities and point clouds now support THREE.js fog, allowing you to add atmospheric effects to your scenes.

Fog in Giro3D

Fog in Giro3D

Geographic graticule

👉 See the dedicated example.

The Map entity can now display a fully customizable geographic graticule on its surface:

  • X and Y pitch setting
  • coordinate origin
  • color
  • opacity
  • line thickness
The graticule with a 500-meter step.

The graticule with a 500-meter step.

GeoTIFF YCbCr and transparency masks

👉 See the interactive example.

A JPEG-compressed GeoTIFF image, using the YCbCr color space and a transparency mask. The green border indicates the image boundary, and is not visible by default.

A JPEG-compressed GeoTIFF image, using the YCbCr color space and a transparency mask. The green border indicates the image boundary, and is not visible by default.

(Fr) [Témoignage client] Émilie Bigorne, géomaticienne EPTB Loire


Latest Images